When you add dynamic text to your page, you are creating a variable whose replacement value is pulled or calculated from your data model and included in your publication at build time. For example, if you have a matrix grid that includes Returns data, you can include dynamic text that adds a summed value from that table to your page. Adding a value as dynamic text ensures that it is always based on the latest value from the processed model.
In addition to pulling values direct from your data into the text fields, you can also create dynamic expressions using PQL or MDX functions that manipulate the returned data. Note: Dynamic text helps you to draw attention to insights that require attention, placing the data-driven content on the publication page.
This topic describes how you can build dynamic text inside your publication. Other dynamic text options allow you to replace variables with information about your publication, replace placeholders with data based on your slicer selections, or integrate dynamic infographics from Illustrate (dynamic images or text).
- Click here for more about publication assets
Configure dynamic text in Publish
Add dynamic text fields to a text box. These fields will be replaced at build time with values from an existing matrix grid or Tabulate visual area that can be transformed using PQL Dynamic or Common expressions.
Before you begin
The data used by your dynamic text is retrieved from either a matrix grid created in Discover or a visual area created in Tabulate. You need to ensure this content is saved (and will therefore be available for selection) before you begin this process.
Tip: Using Tabulate data allows you to blend queries from multiple data sources into a single grid, allowing the dynamic text to be based on multiple data sources.
Step 1: Add a Text Box
Add a basic text box to your canvas, creating the basic text field that will include your dynamic text field.
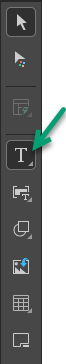
From the Toolbox:
- Click Text.
- Do one of the following:
- Click the canvas at the point where you would like to add your text field.
- Click and drag your cursor to draw a text field on your canvas. (This option allows you to customize the size of your text field.)
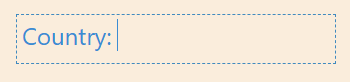
- Type or paste your required text into the text box.
A text box is added to the page at the selected point. Note: You will be able to move it at any time, so don't worry about this being the final location.
Your text field is created. You should re-size, format, or move your text as per your requirements. Once you are ready, remember to save your publication.
Step 2: Add a dynamic text field
Add a temporary dynamic text value to your text field as follows:
- Click inside the text box to place your cursor where you'd like to add the variable.
- Click Dynamic Text > Dynamic Text from the Component ribbon.
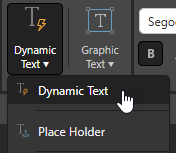
The other options on the Dynamic Text dropdown list allow you to build dynamic placeholders or add variable text fields.
The Dynamic Text panel opens at the bottom of the page.
Step 3: Configure dynamic text
In this step, you will select the data that you want to include in your page and then build an expression that manipulates that selected value.
Tip: After you have created your dynamic text field, you can re-open the Dynamic Text panel at any time by selecting the dynamic text field on the canvas (purple arrow above).
From the Dynamic Text panel:
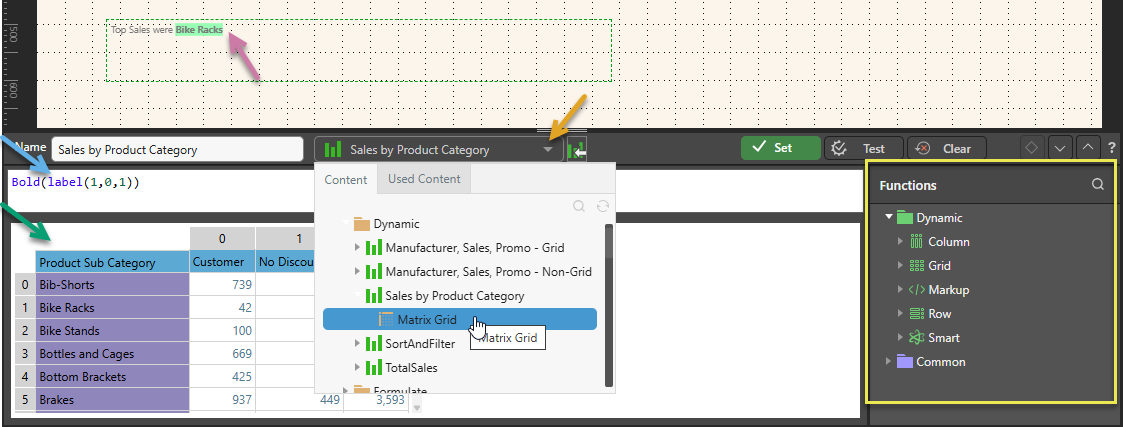
- Open the Content dropdown list (orange arrow above) and select either the Grid from a discovery or the visual area from a tabulation that you want to base your dynamic formula on.
- Build your dynamic expression in the script editor (blue arrow):
- Use the PQL Functions library (yellow highlight) to add SQL expressions to your script. You can hover over the items in the tree to view details of each function and double-click to copy a function into the script editor.
- Select the relevant cells from the grid to populate the given PQL expressions with data. You can click data cells to add the cell value to your expression or, if your source is a matrix grid, click the label, column header, or row header to add the respective content or total of the column or row values instead.
- Once you are happy with your dynamic expression, you should Test your expression and then click Set to create your dynamic function and close the wizard.
Once selected, the Grid or visual area opens in the editor window (green arrow).
Once you have Set your function, the variable is added to the canvas with a highlighted, green background (purple arrow).
Note: The example above replaces the variable on the canvas with the label from the cell at 1,0,1 (currently "Bike Racks"). It also formats the returned value in Bold.
Content

The Content dropdown list (orange arrow above) is used to select the data that you want to base your dynamic formula on. You can select a Matrix Grid from a discovery or a Visual Area from a tabulation. Once you have selected a source, the main panel (green arrow above) is populated with its data and you can select the cells, rows, or columns whose data you want to incorporate into your expression.
Tip: If you want to use Multiple Source Grids, you can use Tabulate to blend queries from multiple data sources into a single tabulation and then define a Visual Area that contains all source data.
The Open Content button (purple arrow) opens the selected Matrix Grid in Discover or the tabulation that contains the selected visual area in Tabulate.
Functions
You can use the PQL functions in the Functions panel to create a PQL expression that adds markup to your value or that manipulates the result before it is used:
- The PQL libraries that are available in this panel are Common and Dynamic.
- You can search the functions by name using the Search field at the top of the Functions panel.
- You can hover your cursor over the item in the Functions tree to show a description of the available function, including its syntax.
- You can also double-click the functions in the tree to copy them into the Formula window. If you select content in the Formula panel and then double-click a function, anything that is selected is inserted within the parentheses.
Note: The Pyramid Query Language (PQL), pronounced "Prequel," is a language built into Pyramid's PYRANA engine to allow users to construct queries that can run against the many SQL data stacks that Pyramid can query natively. PQL includes a vast array of operations and functions that allow users to query data and build analytical logic.
- Click here for more worked examples of PQL expressions
Step 4: Format your text (optional)
It is important to think about the data that will be returned from your function. Will it be the single value, a Boolean, or a paragraph derived from your function? You should format and resize your text and text box accordingly!
You can format the text by resizing the text box, moving it to a more appropriate location on the canvas, changing the font formatting, and so on. As with any other content item, you can use the standard editing options on the right-click menu, the component ribbon, and the canvas to manage your text formatting.
- Click here for more about canvas options (resize, move, and so on)
- Click here for more about formatting from the Component ribbon
Step 5: Check your dynamic text at build time
You should always check that your changes have the effect you intended. Build the publication by clicking Run or F2 and check the dynamic text fields are replaced as expected.
Note: This is particularly important where your dynamic text is affected by slicers at build time; for example, if your dynamic text reflects the top Sales and that data is sliced to reflect a particular country in the output document.
Dynamic text field PQL examples
You can customize your dynamic text using PQL from the Common and Dynamic libraries:
The functions in the Dynamic library can be used to apply Markup to your value, to make selections from or manipulate content from the grid, column, or row, or to return smart (AI-driven) content. For example, if cell 0,0 includes the name of a customer in a Matrix Grid, you can use Italics(data(0,0)) to italicize the returned value or use LLM("what is the meaning of" + data(0,0)) to return a long-form text description of the customer from the internet. Alternatively, you could pick and manipulate numeric fields; for example, Format(TotalColumn(1), "%,.2f") to get the total value from column 1 and format it to show two decimal places.
Note: In each of the preceding example cases, you could also "slice" the Grid to incorporate a different value in cell 0,0 or column 1 depending on your selection.
Sales in Dollars (2 Decimal Places)
You can use the PQL Functions library to prefix a dollar character to some data and show the value with two decimal places (CurrencyDollars2). In a final PDF, this might appear as follows (orange arrow below):
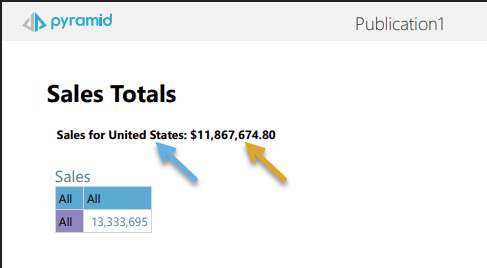
When the output PDF is built and United States is selected from the Slicer:
- The placeholder (blue arrow) is replaced with the name of the selected country.
- The dynamic text field (orange arrow) is replaced with the current Sales value in the United States.
Note: The Sales table, in this example, is not filtered; it shows all Sales.
Configure the Dynamic Text in the Dynamic Function panel as follows:
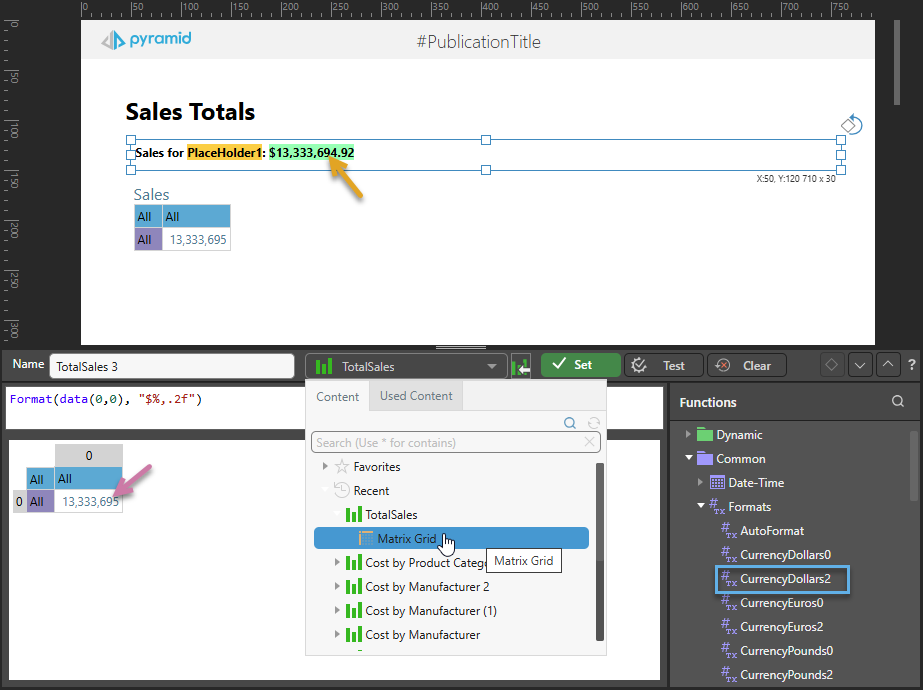
- Select the TotalSales Matrix Grid and then click the cell 0,0 (purple arrow) to indicate that the content of this cell should drive the function.
- Select the CurrencyDollars2 function (blue highlight) to Format the value as required. You can hover over the function to see its full description, including syntax details.
The expression is: Format(data(0,0), "$%,.2f")
Create the interaction between the slicer and the Dynamic Function using the Interaction Manager:
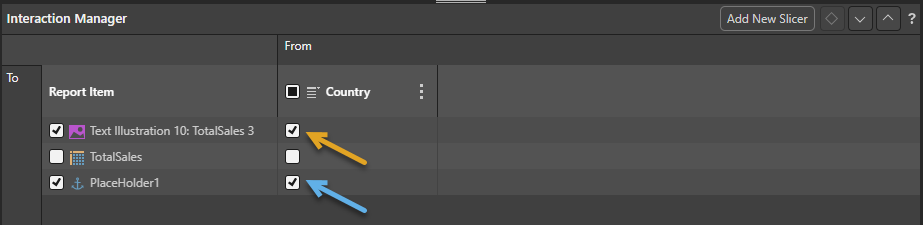
- Select the checkbox between the Country slicer and Dynamic Function (orange arrow above). Note that the name of the Dynamic Function matches that in the Dynamic Function panel (TotalSales 3).
- Optionally, select the checkbox between the slicer and the other content items. In this example, we create an interaction between the slicer and the placeholder (blue arrow), but not between the slicer and the Matrix Grid. This leaves the sales grid unfiltered, but the dynamic text and its label filtered by the selected country.
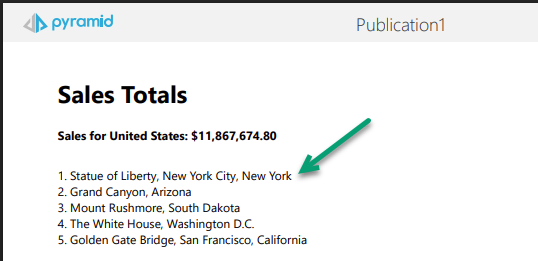
Add some information from the internet (LLM)
You can use the LLM function in the PQL Functions library to add additional information and background to your publication. For example, you could return some information about the landmarks in a selected country. In a final PDF, this might appear as follows (green arrow below):
To enable this functionality:
- Specify the following in the Dynamic Function panel:
LLM("List top 5 landmarks in " + label(1,0,0))Label(1,0,0) references a cell in the selected Matrix Grid or Tabulate visual area containing a country name. - Create an interaction between the Country slicer and the Dynamic Function in the Interaction Manager. Without this interaction, the value from the labeled cell will be used in every publication.
Note: The LLM function can be used to return information from the internet, using your LLM. It cannot tell you about your data set. You can only make use of this functionality if your administrator has selected to Enable Generative AI in the AI Settings page of the Admin Console. Otherwise, the function is not available for use.
Simple Markup
In the Dynamic text field, click the label that you want to add to your page and, with the label value selected, double-click the Bold() function from the Functions list to produce the following: Bold(label(1,0,0)). At build time, the label is added to your page in <b>bold</b>.
For more information about the function, see Bold.
Related information
Formatting
- Empty Strings: If the data point that underlies your dynamic text is empty, and empty strings is disabled (the default), that dynamic text will simply appear blank. To replace the value with the string "EMPTY" instead, enable the Empty Strings option.
- Highlights: Select whether to show dynamic text (from the data model or created as variable text fields or placeholders) with a highlighted background.
- Auto Translate: You can automatically translate any dynamic text in your publication using Pyramid's AI-driven Auto Translate feature. This is done by clicking the Auto Translate option on the Design ribbon and configuring the Auto Translate tool.
Using the LLM PQL Function
Pyramid's Generative AI integration enables you to use AI to generate scripts and images, dynamic text and infographics, calculations and lists, schedules, colors, and more. It allows you to generate a range of content, including complex code, simply by providing a text prompt.
Tip: You can use the LLM PQL function (from the Common PQL functions) to generate dynamic text, adding the results to custom tooltips, text fields, or into your PQL formulas. While this function cannot tell you about your data set, it can add additional information and background to your presentation or publication.
Warning: When using LLMs, your assets are generated using public domain algorithms. This can produce erroneous and inconsistent or random results. Use at your own risk.